It is always very handy to know how to run a statistical test using various softwares and tools. In Google Sheets you can compare the means of two groups and check whether the difference is statistically different using the T.TEST function
This applies, for example, to an A/B test where one want to compare the average revenue generated between the control and the variant and checks if the variant impacts revenue in a statistically significant fashion.
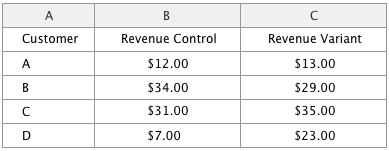
Let’s get some data first:

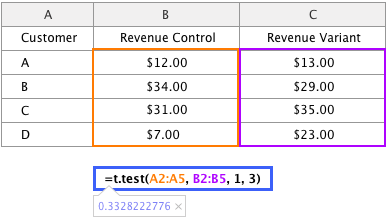
We can now apply T.TEST function
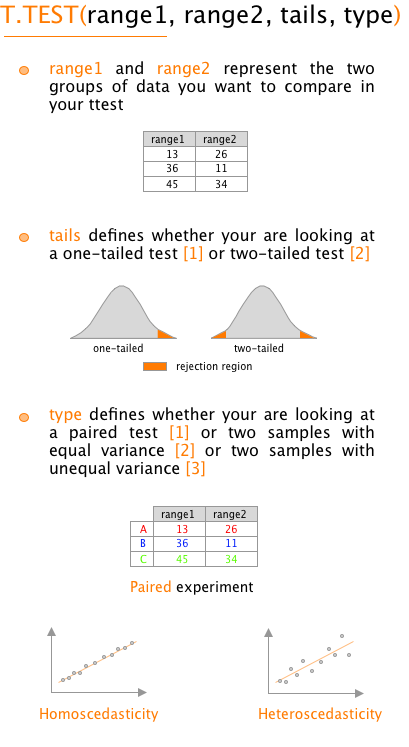
The T.TEST function has four parameters: the range of the two groups, a number representing whether we are running a one-tailed (1) or two-tailed (2) test and finally whether the experiment is a paired (1), equal variance (2) or unequal variance (3) experiment. All of this is summarised below.

Function summary

