We run an A/B test to understand how a new design of a landing page might impact the number of vivitors clicking a CTA. We set up two pages: the control (default design) and a variant (new design). For both we collect the number of visitors clicking or not the CTA.
At the end of the experiment we collect all the data in a Google Sheets, now what is left to do is to determine whether the new design has an impact on the metric of interest. In order to do so we can leverage the CHITEST function in Google Sheets and I will show you how!
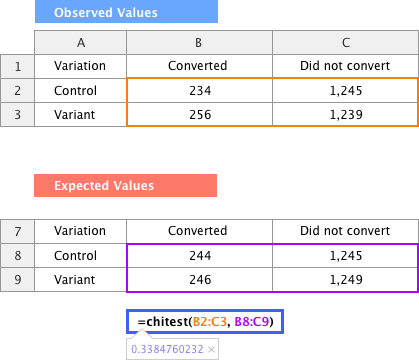
Let’s have a look at the data collected first:

Let’s apply the CHITEST function
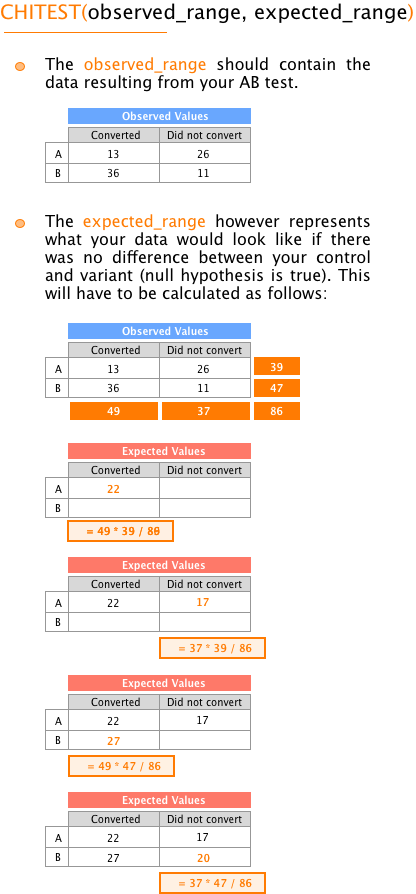
The CHITEST function has two parameters: the observed range which corresponds to the data resulting from an AB test as showed in the previous step; and the expected range which needs to be calculated.
The expected values are the values that would have resulted if the null hypothesis was true or in other words if there was no difference between the variant and the control. The details of the calculation can be found in the next step, but for now let’s see how we write the function in Google Sheets.

Function summary

