“How long should we run the AB test for?” is one of the most common questions asked when working in any department running experiments. This is indeed a very important one that needs to be answered and there are countless sample size calculators out there to help you. However these calculators might give very different answers because they can be based on different formulas - also they might disappear suddenly if the site they are on is no longer online. Having one on your own that you can rely on seems crucial. Building one in Google Sheets is easy. In this post I will show you how.
By the way, if you do not want to follow along and read the full blog post here is a Google Sheets that includes the sample size calculator (feel free to make a copy) so you can get crackin' straight away. Otherwise please read on.
It all starts with the formula. I will cover the case of a binary variable only as it is the most common. A conversion can be thought of as a binary variable (do people convert or not, click on a cta or not etc… there are only two outcomes) and as such a conversion rate falls within the case I will take you through here. So back to the formula, I will apply the following one:
n = f(α/2, β) × [p1 × (100 − p1) + p2 × (100 − p2)] / (p2 − p1)2

with
f(α, β) = [Φ-1(α) + Φ-1(β)]2
I am referring to this sample size calculator where the reference for the formula is clearly cited: Pocock SJ. Clinical Trials: A Practical Approach. Wiley; 1983.
At a high level: α is the significance level, often equal to 0.05 and 1-β is the power of the test which is often 0.8. p1 is the historical conversion rate on the page you are trying to optimize for example. p2 is the conversion rate expected for the variant which is basically the historical conversion rate plus the expected uplift. Finally Φ-1 is the cumulative distribution function of a standardised normal deviate - nothing to be worried about here as we can calculate it pretty easily in Google Sheets.
First let's create the input area of our sample size calculator
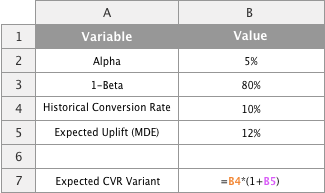
We will use the range from A1 to B4 to define the inputs for our sample size calculator. First we set α to 5% and 1-β to 80%. Then input the historical conversion rate related to the test you want to run. Let's say you want to improve the number of visitors signing up for your newsletter in your homepage. You can leverage Google Analytics, your data warehouse or ask your favorite data analyst to dig out the proportion of visitors who signed up in the past few months. Finally you need to estimate the uplift (in relative terms) that you expect as a result of implementing your variant.

Implementation of the Power Calculator
First let's calculate the expected conversion rate for the variant based on the historical conversion rate and the expected uplift. We will input in cell B7:
=B4*(1+B5)
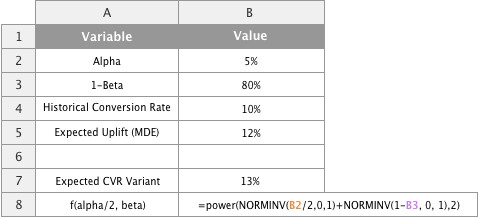
Next step is to calculate the f(α/2, β) part of the formula. It sounds daunting but it is quite easy using the NORMINV formula in Google Sheets. This is basically the implementation of the Φ-1 part mentioned in the previous chapter. Let's now type in cell B8 the following:
=power(NORMINV(B2/2,0,1)+NORMINV(1-B3, 0, 1),2)
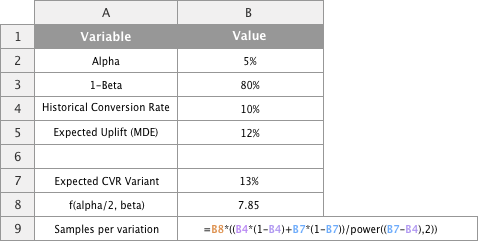
The rest of the implementation is quite straight forward. In cell B9 we want to enter the following:
=B8*((B4*(1-B4)+B7*(1-B7))/power((B7-B4),2))
The power calculator tells us that one needs 12,000 visitors per group, so 24,000 in total (control + variant), to be able to detect an uplift of 10% over the control.
Last thoughts
Congratulations! You have just built your own sample size calculator. You can now start dimensioning your experiments by comparing the output of the calculator against the traffic you generate to understand how many days you should be running the test for.
Usually defining the expected uplift or Minimum Detectable Effect is quite difficult. One should run various scenarios to find out which uplift makes sense in the context of your historical conversion rate and traffic.
If you are tech savvy and know how to leverage Apps Script - the next step would be to automate the sample size calculation for a list of MDEs to obtain a contingency table linking expected uplifts to test durations. Then you are in a position to make a data driven decision about which MDE might be best to target.
